Sunday, December 31, 2006

Managing MySQL on Solaris 10: Part 7: Solaris Performance Tuning and Performance Monitoring Tools 2

Another great tool is lsof which provides a list of open files. Unfortunately, once again, it does not come pre-installed on Solaris. What that means is you must install it. The good thing is, it is worth the five minutes that go into its installation.

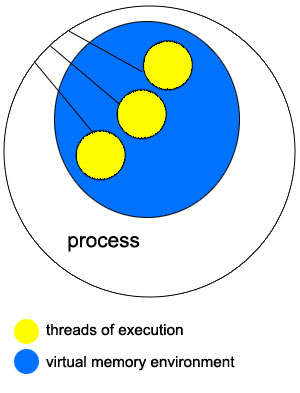
Before we go into how to install lsof, let's discuss a bit about how lsof works. Lsof works by reading kernel's proc structure information to obtain information about open UNIX dialect files. Lsof relates this information to the user structure. It then reads the open file structures that are normally stored in the user structure. From the 00PORTING file distributed with lsof:

Lsof stores information from the proc and user structures in an
internal, local proc structure table. It then processes the open
file structures by reading the file system nodes that lie behind
them, extracting and storing relevant data in internal local file
structures that are linked to the internal local process structure.

Once all data has been gathered, lsof reports it from its internal,
local tables.


Installing lsof
lsof installs itself in /usr/local

-bash-3.00$ cd /home/fmashraqi/install/
-sparc-local.gzt ftp://ftp.sunfreeware.com/pub/freeware/sparc/10/lsof-4.77-sol10
--23:04:59-- ftp://ftp.sunfreeware.com/pub/freeware/sparc/10/lsof-4.77-sol10-sparc-local.gz
=> `lsof-4.77-sol10-sparc-local.gz'
Resolving ftp.sunfreeware.com... 66.193.208.66
Connecting to ftp.sunfreeware.com[66.193.208.66]:21... connected.
Logging in as anonymous ... Logged in!
==> SYST ... done. ==> PWD ... done.
==> TYPE I ... done. ==> CWD /pub/freeware/sparc/10 ... done.
==> PORT ... done. ==> RETR lsof-4.77-sol10-sparc-local.gz ... done.
Length: 475,821 (unauthoritative)

100%[=================================================================================================================>] 475,821 1.02M/s

23:05:00 (1.01 MB/s) - `lsof-4.77-sol10-sparc-local.gz' saved [475821]

[root@db:/home/fmashraqi/install] ls
SUNWhea lsof-4.77-sol10-sparc-local.gz
bench sysbench
gcc test.c
innotop
[root@db:/home/fmashraqi/install] gunzip lsof-4.77-sol10-sparc-local.gz
[root@db31:/home/fmashraqi/install] pkgadd -d lsof-4.77-sol10-sparc-local

The following packages are available:
1 SMClsof lsof
(sparc) 4.77

Select package(s) you wish to process (or 'all' to process
all packages). (default: all) [?,??,q]: y

ERROR: Entry does not match available menu selection. Enter the number
of the menu item you wish to select, or the token which is associated
with the menu item, or a partial string which uniquely identifies the
token for the menu item. Enter ?? to reprint the menu.

Select package(s) you wish to process (or 'all' to process
all packages). (default: all) [?,??,q]: 1

Processing package instance from

lsof(sparc) 4.77
Vic Abell
Using as the package base directory.
## Processing package information.
## Processing system information.
5 package pathnames are already properly installed.
## Verifying disk space requirements.
## Checking for conflicts with packages already installed.
## Checking for setuid/setgid programs.

The following files are being installed with setuid and/or setgid
permissions:
/usr/local/bin/lsof
/usr/local/bin/sparcv7/lsof
/usr/local/bin/sparcv9/lsof

Do you want to install these as setuid/setgid files [y,n,?,q] y

Installing lsof as

## Installing part 1 of 1.
/usr/local/bin/lsof
/usr/local/bin/sparcv7/lsof
/usr/local/bin/sparcv9/lsof
/usr/local/doc/lsof/00.README.FIRST
/usr/local/doc/lsof/00CREDITS
/usr/local/doc/lsof/00DCACHE
/usr/local/doc/lsof/00DIALECTS
/usr/local/doc/lsof/00DIST
/usr/local/doc/lsof/00FAQ
/usr/local/doc/lsof/00LSOF-L
/usr/local/doc/lsof/00MANIFEST
/usr/local/doc/lsof/00PORTING
/usr/local/doc/lsof/00QUICKSTART
/usr/local/doc/lsof/00README
/usr/local/doc/lsof/00TEST
/usr/local/doc/lsof/00XCONFIG
/usr/local/doc/lsof/lsof.man
/usr/local/man/man8/lsof.8
[ verifying class ]

Installation of was successful.


See, Solaris isn't so bad :)

Now let's test whether it runs nicely.

[root@db:/home/fmashraqi/install] lsof | more
COMMAND PID USER FD TYPE DEVICE SIZE/OFF NODE NAME
sched 0 root cwd VDIR 32,96 1024 2 /
init 1 root cwd VDIR 32,96 1024 2 /
init 1 root txt VREG 32,96 49016 5650 /sbin/init
init 1 root txt VREG 32,96 51084 3624 /lib/libuutil.so.1
init 1 root txt VREG 32,96 20572 3587 /lib/libdoor.so.1
init 1 root txt VREG 32,96 142996 3614 /lib/libscf.so.1
init 1 root txt VREG 32,96 5436 6795 /platform/SUNW,Sun-Fire-V440/lib/../../sun4u-us3/lib/libc_psr.so.1
init 1 root txt VREG 32,96 845916 3602 /lib/libnsl.so.1
...


We can get lsof to only display the files that are opened by mysqld process.

[root@db:/home/fmashraqi/install] ps -ef | grep mysqld
mysql 26297 26275 0 Dec 29 ? 8263:23 /usr/local/mysql/bin/mysqld --defaults-file=/opt/db/mysql/product/production/et
root 11143 10642 0 23:44:13 pts/18 0:00 grep mysqld
root 26275 1 0 Dec 29 ? 0:00 /bin/sh /opt/bin/mysqld_safe --defaults-file=/opt/d


Once we have the PID, we can use the -p option to filter by PID.
[root@db:/] lsof -p 26297 | more
COMMAND PID USER FD TYPE DEVICE SIZE/OFF NODE NAME
mysqld 26297 mysql cwd VDIR 118,102 6656 7852 /opt/db/mysql/data
mysqld 26297 mysql txt VREG 118,102 6342120 7831 /opt/db/mysql/mysqld
mysqld 26297 mysql 0r VCHR 13,2 6815752 /devices/pseudo/mm@0:null
mysqld 26297 mysql 1w VREG 118,102 24343140 7853 /opt/db/mysql/data/db.err
mysqld 26297 mysql 2w VREG 118,102 24343140 7853 /opt/db/mysql/data/db.err
mysqld 26297 mysql 3u IPv4 0x3000dc9ccc0 0t0 TCP *:3306 (LISTEN)
mysqld 26297 mysql 4r DOOR 0t0 48 /var/run/name_service_door (door to nscd[13895]) (FA:->0x60007e42ac0)
mysqld 26297 mysql 5u unix 105,815 0t0 55050244 /devices/pseudo/tl@0:ticots->/tmp/mysql.sock (0x6000d970e60) (Vnode=0x3001b8ddc40)
mysqld 26297 mysql 6w VREG 118,102 132755952 7561 /opt/db/mysql/data/db-slow.log
mysqld 26297 mysql 7w VREG 118,102 1070493244 8904 /opt/db/mysql/data/db2-bin.003663
mysqld 26297 mysql 8u VREG 118,102 1938 7617 /opt/db/mysql/data/db-bin.index
mysqld 26297 mysql 9uW VREG 118,102 6627000320 7703 /opt/db/mysql/data/db-InnoDB
mysqld 26297 mysql 10u VREG 118,102 128886 7658 /opt/db/mysql/product (/dev/dsk/c0t0d0s6)
mysqld 26297 mysql 11u VREG 118,102 1668 7677 /opt/db/mysql/product (/dev/dsk/c0t0d0s6)
mysqld 26297 mysql 12uW VREG 118,102 277872640 7704 /opt/db/mysql/data/ib_logfile0
mysqld 26297 mysql 13uW VREG 118,102 277872640 7705 /opt/db/mysql/data/ib_logfile1
mysqld 26297 mysql 14u VREG 118,102 28 7683 /opt/db/mysql/data/master.info
mysqld 26297 mysql 15u VREG 118,102 0 7679 /opt/db/mysql/product (/dev/dsk/c0t0d0s6)
mysqld 26297 mysql 16u VREG 118,102 4 7738 /opt/db/mysql/data/db-relay-bin.000002
mysqld 26297 mysql 17u VREG 118,102 46 7718 /opt/db/mysql/data/db-relay-bin.index
mysqld 26297 mysql 18u VREG 118,102 28 7721 /opt/db/mysql/data/relay-log.info
mysqld 26297 mysql 19r VREG 118,102 4 7716 /opt/db/mysql/data/db-relay-bin.000001
mysqld 26297 mysql 20u IPv4 0x60003395380 0x6ff2c0a TCP db.domain.net:3306->st4.domain.net:50189 (ESTABLISHED)
mysqld 26297 mysql 21u VREG 118,102 35197 8810 /opt/db/mysql/product (/dev/dsk/c0t0d0s6)
--More--


If we don't want to have to search for the PID, we can simply specify the process name with the -c option:

[root@db:/] lsof -c mysqld

To get a count of how many LWPs have a given file open, try something like the following:

[root@db:/] lsof -p 26297 > /home/fmashraqi/logs/db2.lsof.1536; cat /home/fmashraqi/logs/db2.lsof.1536 | awk '{print $9}' | awk 'BEGIN {FS=":"} {print $1}' | sort |  uniq | while read i; do num=` grep "$i" /home/fmashraqi/logs/db2.lsof.1536 | wc -l`; echo "$num    $i"; done | more


After lsof has been installed, it is very worthwhile to read the 00.README.FIRST file in the /usr/local/doc/lsof.

Although I haven't, remember that it is highly recommended that you build your own lsof instead of using a pre-built binary.

Who is using a given file?
lsof can tell us about who is using a specified file

[root@db:/] lsof /opt/db/mysql/data/db1/subscribers.MYD | more
COMMAND PID USER FD TYPE DEVICE SIZE/OFF NODE NAME
mysqld 26297 mysql 45u VREG 118,102 1176704 7646 /opt/db/mysql/data/db1/subscribers.MYD
mysqld 26297 mysql 48u VREG 118,102 1176704 7646 /opt/db/mysql/data/db1/subscribers.MYD
mysqld 26297 mysql 82u VREG 118,102 1176704 7646 /opt/db/mysql/data/db1/subscribers.MYD
mysqld 26297 mysql 94u VREG 118,102 1176704 7646 /opt/db/mysql/data/db1/subscribers.MYD
mysqld 26297 mysql 255u VREG 118,102 1176704 7646 /opt/db/mysql/data/db1/subscribers.MYD
mysqld 26297 mysql 321u VREG 118,102 1176704 7646 /opt/db/mysql/data/db1/subscribers.MYD
mysqld 26297 mysql 420u VREG 118,102 1176704 7646 /opt/db/mysql/data/db1/subscribers.MYD


To get the total count
[root@db:/] lsof /opt/db/mysql/data/db1/subscribers.MYD | wc -l
784


To view all the network socket files open on a machine, supply the -i option.

[root@db:/] lsof -i | more
...
mysqld 26297 mysql 2991u IPv4 0x60007853400 0t12414219 TCP db.domain.net:3306->client.domain.net:40252 (ESTABLISHED)
...


For sshd connections a connection of IPv6 type, similar to the one below, may be noticed in lsof -i output:

sshd      23895   root    4u  IPv6 0x300153f4200     0t19040  TCP db.domain.net:ssh->client.domain.net:61885 (ESTABLISHED)


If you would like to filter the open network connections output by specifying a host, you can do that:
[root@db:/] lsof -i@client.domain.net
COMMAND PID USER FD TYPE DEVICE SIZE/OFF NODE NAME
mysqld 26297 mysql 30u IPv4 0x6000b106200 0t5170868 TCP db.domain.net:3306->client.domain.net:44608 (ESTABLISHED)


Similarly, we can further filter by specifying the protocol in use

[root@db:/] lsof -iTCP@client.domain.com
# or
[root@db:/] lsof -iTCP@client.domain.com:40259


To view network connections of type IPv4 or IPv6
[root@db:/] lsof -i4
[root@db:/] lsof -i6


Another cool thing you can do is to match netstat output with lsof. First find the remote address in netstat output that you are interested in matching. For instance:
[root@db:/]netstat
db.3306 my.46726 66608 0 49232 0 CLOSE_WAIT


Now specify the remote address as a parameter to lsof option -i:
[root@db:/] lsof -i TCP@my:46726
COMMAND PID USER FD TYPE DEVICE SIZE/OFF NODE NAME
mysqld 26297 mysql 627u IPv4 0x60003840040 0t304 TCP db.domain.net:3306->my.domain.net:46726 (CLOSE_WAIT)


If we want to see the connections opened by the mysql user we can use the -u option:
[root@db:/] lsof -umysql

To see connections opened by both the mysql user and the root user:
[root@db:/] lsof -umysql,root


We can also see connections opened by all users except mysql
[root@db:/] lsof -u ^root


To tell lsof not to lookup hostnames
lsof -n


Check out the lsof FAQ page.

Managing MySQL on Solaris 10: Part 6: Solaris Performance Tuning Tools 1

Part 5 of "Managing MySQL on Solaris 10" series will be published later

In Solaris, a process can be in any of the following states during the course of its execution.

O Running
S Sleeping
R Runnable (in dispatch queue)
Z Zombie
T Terminated
C* CPU

Using uptime to get quick summary statistics
-bash-3.00$ uptime
2:18pm up 119 day(s), 12:38, 56 users, load average: 1.00, 0.84, 0.81


[root@db:/] uptime
2:19pm up 194 day(s), 1:59, 16 users, load average: 16.64, 11.16, 13.32


When the competition for processor and other resources gets intense, the processes start getting increasingly delayed. We can see that on the db server, at the time of run queue being sampled, there were between 13 to 16 processes waiting to run (ready for CPU).

What processes are running?
One way to see what processes are running is to use the ps -el command. The e option displays information about every process that is currently running, while the l option specifies that the long listing format be used to display the information.

[root@db:/] ps -el | more
F S UID PID PPID C PRI NI ADDR SZ WCHAN TTY TIME CMD
1 T 0 0 0 0 0 SY ? 0 ? 0:43 sched
0 S 0 1 0 0 40 20 ? 298 ? ? 3:09 init
1 S 0 2 0 0 0 SY ? 0 ? ? 1:45 pageout
1 S 0 3 0 1 0 SY ? 0 ? ? 5522:07 fsflush
0 S 0 23152 23147 0 40 20 ? 376 ? pts/8 0:00 bash
0 S 0 8998 8975 0 39 20 ? 178 ? pts/7 0:00 more
0 S 0 23581 23579 0 40 20 ? 164 ? pts/6 0:00 sh
0 O 100 26297 26275 0 40 20 ? 961014 ? 7135:55 mysqld


In the above output:

F: historical flags
S: Process state
UID: ID of the process owner
PID: Process ID
PPID: Parent process ID
C: This is now obsolete. Historically it showed the utilization of the processor for scheduling
PRI: Process priority. In the above output the priority of the mysqld process is 40.
NI: Settings for nice
ADDR: Process address in memory
SZ: Process size. For the mysqld process, the size is 961014. SZ reports the total size of the process in virtual memory (includes all mapped file and devices).
WCHAN: The process is waiting for the resource which has this address.
TTY: What terminal is associated with this process.
TIME: How much time this process has accumulated on the CPU. We can see mysqld process has accumuated almost 7136 minutes.
CMD: The command (name of the process)


In the above output, we can also see that the fsflush process has accumulated a significant amount of time (5522:07 minutes) on the CPU.

The fsflush process flushes write buffers to disk at a predefined interval of time. Some Solaris performance tuning gurus suggest that the fsflush process shouldn't use 5 to 6 percent of the CPU. For dedicated database servers (running mysqld) like this, the fsflush can use more of the CPU, as in this case.

We can see that the fsflush process has used about 78% of the CPU time accumulated by the mysqld process, a figure that is indeed quite high.

Both the scheduler process (sched) and the fsflush process have the priority set to 0, which is the highest possible priority.

By specifying the y option in addition to e and l we can omit the F and ADDR columns and instead include an RSS column. The RSS column stands for "resident set size" of the process. One thing that is important to note is that when the y option is specified, the display units are changed to kilobytes instead of the default unit size of pages.

[root@db:/] ps -ely | more
S UID PID PPID C PRI NI RSS SZ WCHAN TTY TIME CMD
T 0 0 0 0 0 SY 0 0 ? 0:43 sched
S 0 1 0 0 40 20 440 2384 ? ? 3:09 init
S 0 2 0 0 0 SY 0 0 ? ? 1:47 pageout
S 0 3 0 1 0 SY 0 0 ? ? 5522:52 fsflush
S 0 19873 19872 0 40 20 104 2856 ? pts/12 2:41 top
S 0 7 1 0 40 20 520 9024 ? ? 29:20 svc.star
S 0 9 1 0 40 20 368 9664 ? ? 5:49 svc.conf
S 0 142 1 0 40 20 416 2320 ? ? 10:02 in.mpath
S 1 101 1 0 40 20 1688 4704 ? ? 14:15 kcfd
S 0 23202 23197 0 40 20 440 3008 ? pts/9 0:00 bash
S 0 378 1 0 40 20 288 2384 ? ? 0:07 snmpdx
S 0 100 1 0 40 20 208 2832 ? ? 0:00 devfsadm
S 0 8970 8968 0 40 20 800 1312 ? pts/7 0:00 sh
S 0 92 1 0 40 20 128 2544 ? ? 0:00 sysevent
S 0 23572 308 0 40 20 720 8584 ? ? 0:00 sshd
S 0 13895 1 0 40 20 1968 4400 ? ? 18:58 nscd
S 0 23147 23145 0 40 20 232 1312 ? pts/8 0:00 sh
S 0 91 1 0 40 20 528 4256 ? ? 34:32 picld
S 0 23152 23147 0 40 20 440 3008 ? pts/8 0:00 bash
S 0 8739 8737 0 40 20 232 1312 ? pts/4 0:00 sh
S 0 17517 17510 0 40 20 328 8272 ? ? 0:00 sshd
S 0 225 7 0 40 20 240 2016 ? ? 0:07 sac
S 0 23742 23735 0 40 20 328 8272 ? ? 0:00 sshd
S 0 309 1 0 40 20 416 8320 ? ? 5:40 fmd
S 0 236 1 0 40 20 440 1288 ? ? 1:24 utmpd
S 0 27866 7 0 40 20 208 2104 ? console 0:00 ttymon
S 0 23197 23195 0 40 20 232 1312 ? pts/9 0:00 sh
S 0 293 1 0 40 20 792 3896 ? ? 0:45 syslogd
S 0 23888 308 0 40 20 720 8584 ? ? 0:00 sshd
S 0 308 1 0 40 20 800 3936 ? ? 1:32 sshd
S 0 23581 23579 0 40 20 232 1312 ? pts/6 0:00 sh
S 100 26297 26275 3 40 20 7216696 7688112 ? ? 7241:22 mysqld
S 60001 403 1 0 40 20 344 2048 ? ? 4:07 nrpe


By dividing the SZ column for the mysqld process by 1024, we can get virtual memory usage by the mysqld process in megabytes. In the example above, the mysqld process is using 7688112 /1024 = 7151.6 MB or 89.4% of the virtual memory.

How many threads are associated with each process?
To find out how many threads are associated with the mysqld process, we can run the ps command with customized output. The output of ps can be customized by supplying the -o option. For instance, to show the number of LWPs associated, we specify nlwp after -o.

[root@db:/] ps -ef -onlwp -oargs | more
NLWP COMMAND
1 sched
1 /sbin/init -r
1 pageout
1 fsflush
1 top
11 /lib/svc/bin/svc.startd -r
13 /lib/svc/bin/svc.configd
1 /usr/lib/inet/in.mpathd -a
3 /usr/lib/crypto/kcfd
1 /usr/bin/bash
1 /usr/lib/snmp/snmpdx -y -c /etc/snmp/conf
6 devfsadmd
1 -sh
14 /usr/lib/sysevent/syseventd
1 /usr/lib/ssh/sshd
25 /usr/sbin/nscd
1 -sh
6 /usr/lib/picl/picld
1 /usr/bin/bash
1 -sh
1 /usr/lib/ssh/sshd
1 /usr/lib/saf/sac -t 300
1 /usr/lib/ssh/sshd
15 /usr/lib/fm/fmd/fmd
1 /usr/lib/utmpd
1 /usr/lib/saf/ttymon -g -d /dev/console -l console -T sun -m ldterm,ttcompat -h
1 -sh
13 /usr/sbin/syslogd
1 /usr/lib/ssh/sshd
1 /usr/lib/ssh/sshd
1 -sh
1210 /usr/local/mysql/bin/mysqld --defaults-file=/opt/db/mysql/product/production/et


We can see that mysqld process currently has 1210 threads associated to it.

Another tool to monitor performance is by using top. Unfortunately, top is not included by default on Solaris systems. The good news is that you can get it from www.sunfreeware.com.

When using top, beaware of broken top. Consider the following top output:
last pid:  9350;  load avg:  20.6,  17.8,  15.4;       up 194+03:23:12                                                                              15:43:04
90 processes: 89 sleeping, 1 on cpu
CPU states: 13.8% idle, 58.2% user, 28.1% kernel, 0.0% iowait, 0.0% swap
Memory: 8192M phys mem, 119M free mem, 16G swap, 11G free swap

PID USERNAME LWP PRI NICE SIZE RES STATE TIME CPU COMMAND
26297 mysql 999 59 0 7508M 7118M sleep 121.9H 316% mysqld
23646 root 1 59 0 3792K 784K sleep 15:56 0.46% top2
9350 root 1 59 0 2920K 1760K cpu 0:00 0.43% top
23664 root 1 59 0 2432K 816K sleep 7:12 0.16% iostat
23579 root 1 59 0 8272K 808K sleep 1:29 0.03% sshd
13895 root 25 59 0 4400K 1640K sleep 18:57 0.03% nscd
7 root 11 59 0 9024K 520K sleep 29:20 0.02% svc.startd
8968 root 1 59 0 8272K 1264K sleep 0:00 0.01% sshd
91 root 6 59 0 4256K 528K sleep 34:32 0.01% picld
236 root 1 59 0 1288K 440K sleep 1:23 0.01% utmpd
23638 root 1 59 0 8272K 800K sleep 0:19 0.01% sshd
410 root 1 59 0 9416K 2328K sleep 31:28 0.01% snmpd
9 root 13 59 0 9664K 368K sleep 5:48 0.00% svc.configd
309 root 15 59 0 8320K 416K sleep 5:40 0.00% fmd
101 daemon 3 59 0 4704K 1112K sleep 14:15 0.00% kcfd


Notice how top is reporting that mysqld is using 316% of CPU, something that is just not possible. On this machine when I installed a fresh copy of top, I got a totally different (and much more believable picture)

load averages: 14.62, 16.79, 15.29                                                                                                                  15:44:27
90 processes: 88 sleeping, 2 on cpu
CPU states: 38.2% idle, 44.8% user, 17.0% kernel, 0.0% iowait, 0.0% swap
Memory: 8192M real, 124M free, 7619M swap in use, 15G swap free

PID USERNAME LWP PRI NICE SIZE RES STATE TIME CPU COMMAND
26297 mysql 999 54 0 0K 0K cpu/3 122.0H 61.40% mysqld
9356 root 1 59 0 3792K 1456K cpu/1 0:00 0.16% top2
23646 root 1 59 0 3792K 784K sleep 15:56 0.09% top2
23664 root 1 59 0 2432K 816K sleep 7:12 0.04% iostat
20766 root 1 59 0 2432K 856K sleep 4:33 0.01% iostat
23579 root 1 59 0 8272K 808K sleep 1:29 0.01% sshd
91 root 6 59 0 4256K 528K sleep 34:32 0.00% picld
7 root 11 59 0 9024K 520K sleep 29:20 0.00% svc.startd
8975 root 1 59 0 3000K 1568K sleep 0:00 0.00% bash
8968 root 1 59 0 8272K 1264K sleep 0:00 0.00% sshd
410 root 1 59 0 0K 0K sleep 31:28 0.00% snmpd
13895 root 25 59 0 4400K 1640K sleep 18:57 0.00% nscd
101 daemon 3 59 0 4704K 1112K sleep 14:15 0.00% kcfd
142 root 1 59 0 2320K 416K sleep 10:01 0.00% in.mpathd
9 root 13 59 0 9664K 368K sleep 5:48 0.00% svc.configd


Now we can see that top is reporting only 61.40% of CPU is being used by the mysqld process. In addition, top is reporting that CPU is 38.2% idle.

Another, very useful tool to monitor process status is by using prstat, which has been a part of Solaris OS since Solaris 8. prstat provides us with a report on active process statistics. Once invoked, like top, prstat continues to run until it is interrupted by the user.

   PID USERNAME  SIZE   RSS STATE  PRI NICE      TIME  CPU PROCESS/NLWP
26297 mysql 7508M 7140M cpu3 59 0 122:17:36 63% mysqld/1210
23646 root 3792K 784K sleep 59 0 0:15:58 0.1% top2/1
9376 root 4896K 4608K cpu0 59 0 0:00:00 0.1% prstat/1
23664 root 2432K 816K sleep 59 0 0:07:13 0.0% iostat/1
23579 root 8272K 808K sleep 59 0 0:01:29 0.0% sshd/1
20766 root 2432K 856K sleep 59 0 0:04:33 0.0% iostat/1
8968 root 8272K 1272K sleep 59 0 0:00:00 0.0% sshd/1
91 root 4256K 528K sleep 59 0 0:34:32 0.0% picld/6
13895 root 4400K 1184K sleep 59 0 0:18:57 0.0% nscd/25
7 root 9024K 520K sleep 59 0 0:29:20 0.0% svc.startd/11
23188 root 8584K 720K sleep 59 0 0:00:00 0.0% sshd/1
1457 root 1312K 232K sleep 59 0 0:00:00 0.0% sh/1
23638 root 8272K 800K sleep 59 0 0:00:19 0.0% sshd/1
23602 root 8272K 328K sleep 59 0 0:00:00 0.0% sshd/1
17524 root 3016K 432K sleep 59 0 0:00:00 0.0% bash/1
14739 root 8584K 728K sleep 59 0 0:00:00 0.0% sshd/1
22814 root 8584K 720K sleep 59 0 0:00:00 0.0% sshd/1
22828 root 3008K 440K sleep 59 0 0:00:00 0.0% bash/1
8730 root 8584K 704K sleep 59 0 0:00:00 0.0% sshd/1
1455 root 8272K 328K sleep 59 0 0:00:00 0.0% sshd/1
23138 root 8584K 720K sleep 59 0 0:00:00 0.0% sshd/1
19867 root 1312K 232K sleep 59 0 0:00:00 0.0% sh/1
17519 root 1312K 232K sleep 59 0 0:00:00 0.0% sh/1
410 root 9416K 1136K sleep 59 0 0:31:28 0.0% snmpd/1
403 nobody 2048K 344K sleep 59 0 0:04:07 0.0% nrpe/1
23581 root 1312K 232K sleep 59 0 0:00:00 0.0% sh/1
308 root 3936K 744K sleep 59 0 0:01:32 0.0% sshd/1
23888 root 8584K 720K sleep 59 0 0:00:00 0.0% sshd/1
293 root 3896K 584K sleep 59 0 0:00:44 0.0% syslogd/13
23197 root 1312K 232K sleep 59 0 0:00:00 0.0% sh/1
27866 root 2104K 208K sleep 59 0 0:00:00 0.0% ttymon/1
236 root 1288K 440K sleep 59 0 0:01:23 0.0% utmpd/1
309 root 8320K 416K sleep 59 0 0:05:40 0.0% fmd/15
23742 root 8272K 328K sleep 59 0 0:00:00 0.0% sshd/1
225 root 2016K 248K sleep 59 0 0:00:07 0.0% sac/1
17517 root 8272K 328K sleep 59 0 0:00:00 0.0% sshd/1
8739 root 1312K 232K sleep 59 0 0:00:00 0.0% sh/1
23152 root 3008K 440K sleep 59 0 0:00:00 0.0% bash/1
23147 root 1312K 232K sleep 59 0 0:00:00 0.0% sh/1
23572 root 8584K 720K sleep 59 0 0:00:00 0.0% sshd/1
92 root 2544K 128K sleep 59 0 0:00:00 0.0% syseventd/14
8970 root 1312K 760K sleep 59 0 0:00:00 0.0% sh/1
100 root 2832K 208K sleep 59 0 0:00:00 0.0% devfsadm/6
Total: 90 processes, 1396 lwps, load averages: 16.72, 17.71, 16.19


We can filter the output of prstat by specifying PIDs, UIDs, zone IDs, CPU IDs, and even processor set IDs. A list of these IDs can be separated by commas (enclosed in quotes).

By invoking prstat with the a option, we can see information about both users and processes.

prstat -a
PID USERNAME SIZE RSS STATE PRI NICE TIME CPU PROCESS/NLWP
26297 mysql 7508M 6985M cpu0 49 0 135:08:13 36% mysqld/1210
10702 root 4832K 4568K cpu2 59 0 0:00:00 0.1% prstat/1
23646 root 3792K 784K sleep 59 0 0:17:21 0.1% top2/1
23664 root 2432K 816K sleep 59 0 0:07:50 0.0% iostat/1
23579 root 8272K 816K sleep 59 0 0:01:37 0.0% sshd/1
20766 root 2432K 856K sleep 59 0 0:04:38 0.0% iostat/1
91 root 4256K 528K sleep 59 0 0:34:35 0.0% picld/6
13895 root 4400K 1408K sleep 59 0 0:19:00 0.0% nscd/25
7 root 9024K 520K sleep 59 0 0:29:23 0.0% svc.startd/11
23147 root 1312K 232K sleep 59 0 0:00:00 0.0% sh/1
23572 root 8584K 720K sleep 59 0 0:00:00 0.0% sshd/1
92 root 2544K 128K sleep 59 0 0:00:00 0.0% syseventd/14
8970 root 1312K 592K sleep 59 0 0:00:00 0.0% sh/1
100 root 2832K 208K sleep 59 0 0:00:00 0.0% devfsadm/6
378 root 2384K 288K sleep 59 0 0:00:07 0.0% snmpdx/1
NPROC USERNAME SIZE RSS MEMORY TIME CPU
1 mysql 7508M 6985M 87% 135:08:13 36%
91 root 441M 52M 0.5% 2:59:09 0.2%
1 nobody 2048K 352K 0.0% 0:04:07 0.0%
1 daemon 4704K 1680K 0.0% 0:14:17 0.0%

Total: 94 processes, 1400 lwps, load averages: 2.21, 2.62, 2.89


If you would like to see new reports below the old report, specify the c option.

To filter the prstat output to display only processes or lwps that are bound to specified processor sets, specify the "-C" option.

Similarly to get CPU specific prstat report, use the -P option.

To sort the output in descending order specify the -s option followed by one of the five following values:
  • cpu (default)
  • pri (priority)
  • rss (resident set size)
  • size (size of process image)
  • time (process execution time)
To sort by ascending order, use the -S option.

Summary of total statistics can be viewed by using the -t option.

 NPROC USERNAME  SIZE   RSS MEMORY      TIME  CPU
1 mysql 7508M 7036M 88% 135:58:53 38%
91 root 441M 53M 0.5% 2:59:21 0.3%
1 nobody 2048K 352K 0.0% 0:04:07 0.0%
1 daemon 4704K 1552K 0.0% 0:14:17 0.0%

Total: 94 processes, 1400 lwps, load averages: 2.22, 2.47, 2.60


See man prstat for more on the prstat command.

Todo:
Usng psrset how can we make MySQL we bind mysqld process to groups of processors, instead of having it run on a single processor?

Saturday, December 30, 2006

Fotolog is Chile's #3 site

Fotolog: top 3 sites in Chile uses MySQL
Fotolog is the top 28th site in the world, according to Alexa rankings today, and, ofcourse, it uses MySQL :)

MyISAM DELETE statements taking forever

On one of my servers today I noticed some DELETE statements that had been running for more than 14000 seconds due to system locks.

 Queries: 180.2M  qps: 1294 Slow:  173.3k         Se/In/Up/De(%):    09/02/33/00
qps now: 2065 Slow qps: 8.1 Threads: 463 ( 225/ 738) 06/01/49/00
Cache Hits: 610.9k Hits/s: 4.3 Hits now: 4.1 Ratio: 3.9% Ratio now: 3.3%
Key Efficiency: 99.2% Bps in/out: 134.7k/ 1.5M Now in/out: 203.9k/ 1.3M

Id User Host/IP DB Time Cmd Query or State
-- ---- ------- -- ---- --- ----------
18951229 www 192.168.1.170 fl_db1 14516 Query DELETE FROM user_
19003358 www 192.168.1.107 fl_db1 14273 Query DELETE FROM user_
19014485 www 192.168.1.105 fl_db1 14221 Query DELETE FROM user_
19117224 www 192.168.1.109 fl_db1 13733 Query DELETE FROM user_
21707448 www 192.168.1.131 fl_db1 1474 Query DELETE FROM user_


One common misunderstanding is that when system locks are disabled (using --skip-external-locking), threads shouldn't be in "System lock" state. This confusion exists because we see state of "System lock" even when MyISAM locks are in place for a thread.

Key cache is flushed during the unlocking phase and can take some time. During the flush process, it my understanding that all key blocks that have been changed are written to the index file. So size of the key cache plays an important role here.

What I am investigating is why some of the DELETE records ocassionally take as much as 14000 seconds and how can that be decreased.

UPDATE:
So my boss found out the reason for the application issuing excessive DELETE statements. It turned out that within one class our old programmers were using DELETE followed by an INSERT to perform UPDATEs on the table. That is, ofcourse, terrible usage of resources and not to mention its horrible defragmentation effects.

If you ever, for some reason, find yourself in such situation, remember to defragment the tables.

Archival Deletes
Going forward, it would be very nice for MySQL to provide an option (for MyISAM tables) for a DBA to set "archival/status deletes" for a table. What I mean is that whenever a DELETE statement is issued, MyISAM shouldn't actually delete the record but instead mark it as deleted. Then later, those records can be physically deleted periodically, or on demand. I would really love to see something like this to help improve performance of DELETE operations.

One way to "relatively increase" the performance of DELETE statements is to lower its priority by specifying the LOW_PRIORITY attribute.

Read more about table locking issues on MySQL website.

Tuesday, December 26, 2006

Managing MySQL on Solaris 10: Part 4: Solaris Doors and Signals

The Solaris Doors API, originally developed as a core part of the Spring Operating System, is basically nothing more than an RPC mechanism. The Solaris Doors, which are made visible as door descriptors (standard UNIX file descriptors) , relies heavily on threads and allows us to call procedures between processes on the same system. A door client makes a call to a door server which has a thread that is awaken, which passed the scheduling control directly to the thread in the door server. The control and the response is passed back to the calling thread when the door server has completed executing the request.

A door is made visible to other applications by attaching an already existing door descriptor to an existing regular file in the UNIX file system.

Solaris supports the following doors functions

When events like segmentation violation (illegal address references) and floating point exceptions occur, a process or a thread within a process needs to be interrupted. The UNIX signal facility provides for handling such exceptions by notifying a process or a thread of such events.

The signals can be either synchronous or asynchronous depending on the reason and source of the signal.

The segmentation violation and folating point exceptions are examples of synchronous signals, which typically arise as "hardware trap" conditions. The executing instruction stream can cause synchronous signals. These signals are also sometimes refered to as traps because it can cause "a trap into a kernel trap handler."

On the other hand, asynchronous signals such as job control signals and signals to kill a process, arise from external events that may or may not be related to the current instruction stream. These signals are sometimes known as interrupts.

All signals have unique names beginning with SIG. Each signal also has a signal number.

A default disposition (out of four possible ones) is also defined for all possible signals, namely exit, core, stop and ignore.

A process can describe how it is going to handle such signals except when it receives SIGKILL and SIGSTOP since the disposition for these signals cannot be changed. For instance, a process can ignore such signals, catch them, or invoke the default action of a signal. Since Solaris is multithreaded, a signal can be directed to a specific thread within a process. We can also specify which threads will block (mask) which signals.

For more information on signals, read the article "A Primer on Signals in the Solaris OS." If you want more detailed information, get the book, "Advanced Programming in the UNIX Environment" by W. Richard Stevens.

References:

Sunday, December 17, 2006

Managing MySQL on Solaris 10: Part 3: Inter-process communication

Ever wondered how threads exchange data between themselves?

This sharing and exchange of data is made possible by inter-process communication, or IPC for short. There are several different types of inter-process communication for instance (IPC,System V IPC and POSIX IPC). In addition Solaris provides an additional advanced Solaris IPC.

According to Wikipedia:

Inter-Process Communication (IPC) is a set of techniques for the exchange of data between two or more threads in one or more processes. Processes may be running on one or more computers connected by a network. IPC techniques are divided into methods for message passing, synchronization, shared memory, and remote procedure calls (RPC). The method of IPC used may vary based on the bandwidth and latency of communication between the threads, and the type of data being communicated.

Wikipedia's article on Inter-process communication also goes on to say that "It is widely accepted that IPC can be implemented significantly faster in a microkernel environment than in classical monolithic kernel systems1." This means that IPC implementation is not as fast in Solaris (and other Unix systems) as it could be.

The socket that MySQL uses is typically present at /tmp/mysql.sock. This socket is an example of usage of traditional UNIX IPC. Sockets allow processes to communicate directly by providing a communication endpoint.

Another example of traditional UNIX IPC usage is when pipes are created which provides for a communication mechanism. On Solaris, when a pipe is created, "two file descriptors, fildes[0] and fildes[1]. The files associated with fildes[0] and fildes[1] are streams and are both opened for reading and writing. The O_NDELAY, O_NONBLOCK, and FD_CLOEXEC flags are cleared on both file descriptors. The fcntl(2) function can be used to set these flags".

"A read from fildes[0] accesses the data written to fildes[1] on a first-in-first-out (FIFO) basis and a read from fildes[1] accesses the data written to fildes[0] also on a FIFO basis3."

The System V IPC consists of System V shared memory, message queues, and semaphores. Kernel tunable parameters for System V IPC are specified in /etc/system file. In Solaris 10, the defaults of most of these parameters were increased to ease the tuning efforts.

Resources and References:
  1. Hermann Härtig, Michael Hohmuth, Jochen Liedtke, Sebastian Schönberg, Jean Wolter (October 1997). "The performance of μ-kernel-based systems". Proceedings of the 16th ACM symposium on Operating systems principles (SOSP), Saint-Malo, France: 74. ISBN 0-89791-916-5.
  2. Inter-process communication (Wikipedia)
  3. man -a pipe

Friday, December 15, 2006

Managing MySQL on Solaris 10: Part 2: Solaris Kernel Threads Model

The central component of most operating systems is the kernel. The kernel manages the resources of a system. In addition, the kernel facilitates and manages the communication between a system's hardware and software components.

Two levels of execution are provided by hardware: kernel mode execution and user mode execution. When in kernel mode, the software program can access all the instructions and every accessible piece of hardware. A program is in kernel space if running in kernel mode and in user space if running in user mode.

The Solaris kernel is a monolithic kernel, much like most Unix systems, as compared to a microkernel.

The software said to be running in kernel mode is. On the other hand, in user mode, the software cannot access certain some areas of functionality of the hardware. This prevents malicious programs from doing any damage to hardware.

In Monolithic kernels, the parts of the kernel that need to be accessible by most programs are placed in the kernel space. In other words, "the entire kernel is run in kernel space in supervisor mode" [3]. The examples of programs that are in the kernel space include device drivers, memory managers, scheduler, file systems etc.

For a program to be in kernel space, does not necessarily means that a program in user space cannot access its services. A number of system calls are made available to applications so they can access the services of programs that are running in kernel space.

Certain common libraries are not available to programmers programming in kernel space, which makes coding in that environment a bit harder. The problems and limitations associated with monolithic kernels does not end here. Debugging in kernel space is also hard due to the lack of quality debugging tools. For many changes to take effect, rebooting the system is required. Uncatched bugs in one kernel module can bring down the system.


Microkernel systems, on the other hand, place only those parts in kernel space for which being privileged is a requirement. These programs include IPC, basic schedulers, memory handling (basic) and I/O (basic). Other parts, such as memory handling and file systems, that could operate without being in privilege mode were moved to user space.


Solaris kernel, just like the Linux and FreeBSD kernels, are modular in the sense that they can dynamically (at runtime) load and unload modules. Using this dynamic nature of loading modules, the functionality and capability of kernels can be extended.

The Solaris kernel threads model is based on kernel threads, user threads, process and lightweight process objects.

Out of the four objects, it is the kernel threads object that is scheduled for execution, and then executed, on a processor.

Each user process also maintains a non-kernel thread state in the form of user threads.

Each user program has an execution environment known as process. The term process is also used to refer to the executable form of a program. Each process has, at the minimum, one thread of execution.

User threads created inside the process are visible to the kernel. The execution context of a user thread is known as lightweight process, commonly abbreviated as LWP.

The kernel threads are executed by the kernel for tasks related to and needed by the kernel.

The execution state of a kernel thread is saved for later restoration when it is moved off the process for later scheduling.

Thanks to the virtual file system implementation in Solaris OS, we can configure multiple types of file systems at the same time.

As you can expect, complete support for IPv4 and IPv6 is implemented in the networking subsystem of the Solaris kernel.

The following types of loadable kernel modules are supported by the Solaris module framework:
  • file systems (UFS, NFS)
  • scheduler classes (Fixed Priority (FX), Real Time (RT) etc)
  • execute file format loaders
  • loadable system calls (semsys Semaphores)
  • streams modules
  • bus/device drivers (PCI)
  • other/miscellaneous modules (IPC)
Until Solaris 8, a library-level thread scheduler to maintain LWP threads had to be maintained in addition to the kernel thread scheduler. User threads were multiplexed into a pool of LWPs and that created issues with concurrency management and scheduling latency. " The scheduling latency was the effect of waiting for the threads library scheduler to link a user thread to an available LWP4. The concurrency issue has to do with maintaining a sufficient number of LWPs such that the process does not have runnable user threads waiting for an execution resource (an LWP)."

Solaris 8 introduced a single-level model for threads model. With the new single-level model, an LWP and kernel thread are created for each new user thread. The benefit of that is that the user thread always has a LWP and a kernel thread.

Thread applications link to libthread.so, typically placed in /usr/lib directory. On my Sun V210 with Solaris 10, the /usr/lib/libthread.so links to /lib/libthread.so.1

-bash-3.00$ ls -ltr /usr/lib/libthread.so
lrwxrwxrwx 1 root root 24 Mar 30 2005 /usr/lib/libthread.so -> ../../lib/libthread.so.1


If you are still using Solaris 8, the new binary based on single-level model is fully compatible with older model. Applications do not need to be recompiled to use the single-level model binary. On Solaris 8, all we need to do is point the runtime linker's path environmental variable to the new binary. On Solaris 10, the default library is the single-model one. The benefits of the new threads model include improved performance, scalability, and reliability, reliable signal behavior, improved adaptive mutex lock implementation and user-level sleep queues for synchronization objects4.

The scheduling classes in Solaris are TS (Timeshare), IA (interactive [enchanced TS]), FSS (fair-share scheduling), FX (fixed-priority), SYS (system), RT (real-time) and interrupts. The interrupts have the highest priority (160-169).

When you are using Windows, the IA schedule class is being used as it increases the thread priority for the window that has the focus.

Resources:
1. Linux Kernel Archives Provides the Linux kernel source and more
2. Monolithic kernels and micro-kernels
3. Monolithic kernel
4. Solaris Internals

MySQL: Replication stopped: Lock wait timeout exceeded

One of my slave servers stopped twice in the last couple of days. The error in the error log file was:

061214 21:17:41 [ERROR] Slave: Error 'Lock wait timeout exceeded; try restarting transaction' on query. Default database: 'fl_db1'. Query: 'UPDATE user SET total_photos = total_photos + 1 WHERE user_name = '666damy666'', Error_code: 1205
061214 21:17:41 [ERROR] Error running query, slave SQL thread aborted. Fix the problem, and restart the slave SQL thread with "SLAVE START". We stopped at log 'db2-bin.003509' position 342646547


I tried to learn more about the error code using perror and got
-bash-3.00$ perror 1205
Illegal error code: 1205


Information about the error is available on MySQL server error messages page of the manual.


Error: 1205 SQLSTATE: HY000 (ER_LOCK_WAIT_TIMEOUT)

Message: Lock wait timeout exceeded; try restarting transaction


The InnoDB error codes page lists the following information:

1205 (ER_LOCK_WAIT_TIMEOUT)

Lock wait timeout expired. Transaction was rolled back.


So how can we prevent that from happening?

This happens because the value of innodb_lock_wait_timeout was not enough for InnoDB to acquire the lock. On my servers it was set to default: 50.

The manual has following information:

The timeout in seconds an InnoDB transaction may wait for a lock before being rolled back. InnoDB automatically detects transaction deadlocks in its own lock table and rolls back the transaction. Beginning with MySQL 4.0.20 and 4.1.2, InnoDB notices locks set using the LOCK TABLES statement. Before that, if you use the LOCK TABLES statement, or other transaction-safe storage engines than InnoDB in the same transaction, a deadlock may arise that InnoDB cannot notice. In cases like this, the timeout is useful to resolve the situation. The default is 50 seconds.


I am going to investigate reasons behind the lock wait timeout exceeding. For now, let's see if increasing innodb_lock_wait_timeout to 120 will be enough on this slave server.

Unfortunately, we need to restart the server for the new values to take effect.

Thursday, December 14, 2006

Managing MySQL on Solaris 10: Part 1: Introduction

From time to time I receive requests from friends who are interested in learning more about managing MySQL on Solaris 10. To help them (and myself), I am planning to write about the internals of both MySQL and Solaris.

So if you have any questions that relate to adminstering and managing MySQL on Solaris, post them as comment, and though I don't promise, I will do my best to answer them.

What I usually recommend my friends is that they should start learning by finding a good authoritative book. In my opinion, reading one good authoritative book on the subject is better than reading three normal books.

BTW, I used to spend a lot of time finding the right book before buying it. Earlier this year I signed up for Safari Books Online (by O'reilly). My membership gave me a ten slot bookshelf. I really liked the service so I decided to get unlimited access to the books.

One of the books I highly recommend on Solaris is Solaris Internals: Solaris 10 and OpenSolaris Kernel Architecture, Second Edition. It is written by Jim Mauro and Richard McDougall. Community authors for the book include Frank Batschulat (UFS), Russell Blaine, Jeff Bonwick (ZFS) and Bryan Cantrill (DTrace) among many others.

On the MySQL side, the book on the top of my "to-recommend-list" is Pro MySQL by none other than Jay Pipes and Michael Kruckenberg (they both are my friends but that's NOT the reason I am recommending it). Seriously, if you are planning to buy one good authoritative book, buy this one.

Solaris 2.0 was released in 1992. Today, it is one of the leading operating systems offering reliability, performance, scalability, observability and more.

To get the latest information on Solaris, you can look at What's New on http://docs.sun.com/app/docs. On the docs site you can also access a variety of guides. For instance, you can get the Solaris 10 System Administrator Collection.

Solaris ZFS Administration Guide provides information for both SPARC and x86 (64-bit and 32-bit x86 compatible) based systems. This guide will help you in setting up and managing Solaris ZFS file systems.

In case you are wondering what is ZFS, I will let the guide provide the introduction:
"The Solaris ZFS file system is a revolutionary new file system that fundamentally changes the way file systems are administered, with features and benefits not found in any other file system available today. ZFS has been designed to be robust, scalable, and simple to administer."
ZFS, a transactional file system, manages the physical storage using a concept known as storage pools. Using the volume manager you can get the image of a single device and still take advantage of multiple devices.

One cool thing about Solaris is that each new release contains features found in old releases, however new releases may no longer support older hardware.

Solaris 10, a volume production operating system, does not support 32-bit SPARC processors. It doesn't support UltraSPARC I processor either. Solaris 10 only has a 64-bit release which can run on SPARC systems that use UltraSPARC II, UltraSPARC III, or UltraSPARC IV processors. You don't need to worry about 32-bit SPARC programs and applications as they can run without any issue on Solaris 10 64-bit kernel.

A lot of cool and innovative work has been done on Solaris 10. As a result it offers predictive self-healing, Service Management Framework (SMF), Fault Manager, Zones, Dynamic resource pools (DRP), physical memory control, dynamic tracing (DTrace), process rights management and much, much more. More documentation on what's new in Solaris 10 is available online. At the time of writing this post, there have been four Solaris 10 releases: 3/05, 1/06, 6/06 and 11/06.

Like every other DBA, I need a wide variety of tools for monitoring and analyzing system and application performance. On Solaris I get a variety of tools. Some of the tools that come very handy at times include vmstat (virtual memory statistics), mpstat (per-processor statistics), iostat (I/O statistics), netstat (network status), sar (system activity reporter), ptools (process tools), cpustat (CPU performance statistics), busstat (bus-related performance statistics), mdb (modular debugger), prstat (process statistics), truss (trace system calls and signals), apptrace (traces application function calls to Solaris shared libraries) and DTrace.

Solaris 10 has a 64-bit kernel and features process address space. That allows it to deliver a LP64 environment for execution. Long and pointer data types on it are 64 bits wide.

On Solaris 10, thanks to the modular binary kernel, kernel compilations aren't required when kernel parameters are changed or new functionality is added.

Threads can interupt threads that are of lower-priority if they need to run.

Wednesday, December 06, 2006

Changing character set from latin1 to utf8: Alter table vs. dump and import

Chat log with kimseong on #mysql regarding character sets.
 when you dump data in a latin1 table with MySQL, is it converted by default to utf8?
FrankMash: mysqldump? yes it is, but there are options to set it to latin1
kimseong: thanks. I have a table in latin1 that I am planning to dump and then change one field in its structure to be utf8
kimseong: should I dump data in utf8 (default) or specify (latin1) to preserve special chars
FrankMash: alter table can change directly, no need to dump, but backup first anyway
alter table does takes longer than dump/importing in our test
FrankMash: if you data is really stored as latin1, then it does not matter
FrankMash: it gets tricky if data is stored as utf8 in latin1 column
kimseong: thanks. so upon re-importing the data (assuming dump is utf8) will the characters be converted back to the charset specified in the table definition
yes
kimseong: yes that would be tricky. thank you :)

MySQL: Alter table vs. dump / load

Quick question: If one dumps a table (latin1) and then changes the charset of one of the fields to utf8 and then load the dump back, will the result be different than if one had used alter table to convert a field's charset?

Friday, December 01, 2006

relay_log_space_limit stopped working after replication reset?

I recently reset replication on one of my servers and since then my relay_log_space_limit=8G setting has stopped working since the relay log files continue to grow beyond the 8G limit (currently 15G).

Has anyone else experienced this before? Why would it suddenly stop honoring the relay log space limit?